Performance
Churust is fast, and this page is about being precise rather than loud: what was measured, against what, on what, and what the number does not cover.
| keep-alive, 4 workers, median of 9 | req/s | vs. Churust | server CPU µs/req | p99 |
|---|---|---|---|---|
| actix-web 4.14 | 916,364 | 1.12× | 4.20 | 105 µs |
| bare hyper — the floor, not a framework | 895,073 | 1.10× | 4.08 | 113 µs |
| Churust | 816,986 | — | 4.87 | 137 µs |
Linux 6.12, server pinned to CPUs 0–7 and the load generator to 8–11, 64
keep-alive connections, one server running at a time, order rotated each round.
Three routes returning constants. Full method:
benchmarks/README.md.
actix-web leads on all three columns. Churust is not the fastest Rust web framework on this workload and this page will say so until it is.
axum, Ktor and Go were measured on an earlier eight-worker configuration and
have not been re-run against this harness; their figures live in
benchmarks/results/ rather than in this table, because quoting a number
measured under one configuration beneath a table built under another is exactly
how the corrections further down this page became necessary.
Read this before quoting the table
Worker count moves these numbers more than most code changes do. Both
servers default to one worker per core; on this machine that default sits at
different distances from each framework's optimum, so a default-vs-default table
measures the defaults. Everything above is at four workers for every server.
run_sharded(0) picks one per core, which is a starting point rather than an
answer — sweep it for your hardware.
Nine rounds because fewer is not enough. Three consecutive five-round runs of
identical code put Churust 3.6% ahead, then 11% ahead, then 5.9% behind; the
between-run spread on this machine is wider than most of what is being measured.
Read the ranges in benchmarks/results/, not just the medians.
A caveat on the throughput column specifically. CPU/req × req/s gives cores consumed: bare hyper 3.65, actix-web 3.85, Churust 3.98, all on four workers. Churust's workers are saturated while the other two have headroom, which raises the possibility that their throughput is bounded by the four-thread load generator rather than by the server. The CPU-per-request figures are measured directly and do not depend on saturation, so they are the ones to trust; the throughput ordering may be partly an artifact of the harness.
Sharding is a choice you make, and it is a large one. The same code on the same cores, with and without connection pinning — both figures from the earlier eight-worker run, kept because the comparison is the point and both sides were measured together:
| build (8 workers, superseded run) | req/s | server CPU µs/req | p99 latency |
|---|---|---|---|
shared runtime (App::start, the default) | 390,772 | 12.94 | 444 µs |
one runtime per core (App::run_sharded) | 757,930 | 8.39 | 246 µs |
1.94× the throughput, and better tail latency too once the per-connection handoff and the connection loop's per-wake bookkeeping were removed. Pinning a connection to one runtime for its life means a request waits for that worker rather than being picked up by whichever is idle.
With pipelining the order changes. actix-web reaches 5.96M requests a second against Churust's 4.45M — 1.34× — and does it on 1.14 µs of CPU per request against 1.70. Pipelining is not the shape most traffic has, which is why it is not the headline, but it is where Churust's dispatch path is furthest behind.
That gap is Churust's own, and it took a floor to find out. This page used
to say the difference was hyper's HTTP/1 implementation against actix-http's,
reasoning that Churust's dispatch layer measures 393 ns in isolation so the
remainder had to belong to the stack underneath. That was arithmetic, not a
measurement, and it was wrong. benchmarks/bench-hyper now runs the comparison
against hyper and tokio with no framework on top — same routes, same responses,
same one-runtime-per-core shape — and hyper is not the bottleneck:
| keep-alive, 4 workers | req/s | server CPU µs/req | p99 |
|---|---|---|---|
| actix-web | 902,907 | 4.20 | 111 µs |
| bare hyper (the floor) | 902,481 | 4.07 | 110 µs |
| Churust | 814,690 | 4.87 | 131 µs |
hyper answers a request for less CPU than actix-web does, so it was never what the gap was made of. Churust's own layer costs 0.80 µs per request on top of the hyper it runs on, and that is the whole of the distance to actix-web.
The first 0.22 µs of that came back from one line. tokio::time::timeout
takes its future by value, and the future it was being handed is the entire
request — the pipeline, the handler, and the Call threaded through both, 2,616
bytes of it. Every request memcpy'd all of that into the timeout wrapper.
Pinning it first (std::pin::pin!) hands over a Pin<&mut _> instead, and the
future stays where it was already built. Churust went from 5.10 to 4.87 µs per
request and 781,872 to 814,690 req/s, with the confirming run's slowest round
faster than the old best one.
Where the 0.79 µs goes, and what it would take to close it.
Half of it is Churust's dispatch layer and half is the engine around it:
| ns/req | |
|---|---|
| Churust's overhead above the floor | ~790 |
| dispatch — routing, extraction, pipeline | ~400 |
the engine — respond, Call construction, timeout, EngineBody, guards | ~390 |
(Two figures have been published for dispatch, 393 ns and 672 ns, and both are
right about different applications. benches/dispatch.rs builds the default
server, which installs the security-headers middleware — a layer measuring
268–301 ns that bench-churust turns off. Measured in the wire configuration,
dispatch is ~400 ns.)
First place is not reachable by making dispatch faster. Matching actix-web means shedding 790 − 120 = 670 ns, and the entire dispatch layer is ~400. A dispatch layer that cost nothing would leave Churust at 4.47 µs against actix's 4.20.
That is worth stating plainly because the obvious redesign was prototyped rather
than assumed. Replacing Arc<dyn Handler> and the per-layer
Pin<Box<dyn Future>> with monomorphised static dispatch measures 20 ns —
and it inlines every handler's state machine into the request future, working
against the only change this session that measurably helped. actix-web pays more
vtable dispatches and more allocations per request than Churust does and is
still faster. Erasure is not where the money is.
What is reachable without touching the public API is 60–110 ns (~1.7%):
dropping #[async_trait] from the extractor traits, and router work — FxHash,
inline path segments, fusing the three separate scans over the path.
And the largest single win does not show up on this page's charts at all, because it is disabled in the benchmark: the default configuration pays 268–301 ns for security headers, and on the plaintext path applies them twice — once in the middleware, once in the transport — where the second pass reserves six header slots on a map that already holds them, forcing a grow and a rehash to discover there is nothing to do. Every real deployment pays that; no benchmark here measures it.
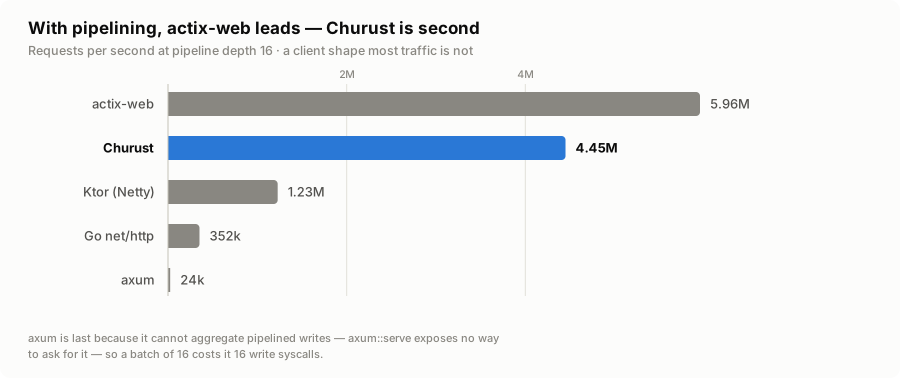
axum's last place there is not about its routing — the keep-alive table shows
that is fine. hyper answers each request in a pipelined batch with its own
flush, and axum::serve exposes no way to turn the aggregation on, so a batch
of 16 costs it 16 write syscalls. Churust can be asked (pipeline_flush).
Numbers move between runs, so read the ranges. The published figures are medians of five rounds with the running order rotated; the results file carries the spread for every row, and any row whose rounds differed by more than 3× is flagged rather than averaged into respectability.
Every route returns a constant. This measures dispatch overhead and says nothing about an application that talks to a database.
Getting the throughput in your own application
The measured configuration is not the default, on purpose. Three knobs:
App::run_sharded — one runtime per core
The default App::start runs every connection on one shared work-stealing
runtime. That balances perfectly, and it lets a connection's read wakeup, its
handler and its write each land on a different thread — an atomic, a cache miss
and usually a syscall per hop. run_sharded gives each worker its own
single-threaded runtime and pins a connection to one for its life.
use churust::prelude::*;
fn main() -> std::io::Result<()> {
    let app = Churust::server()
        .routing(|r| { r.get("/", |_c: Call| async { "hi" }); })
        .build();
    app.run_sharded(0) // 0 = one worker per core
}
Note there is no #[churust::main]: run_sharded builds and owns its runtimes,
and wrapping it in another one leaves a multi-threaded runtime idling underneath
the single-threaded ones doing the work.
Measured against the shared runtime: 1.94× the throughput (391k → 758k), and tail latency improved as well (444 µs → 246 µs). With per-connection affinity a worker whose connections are busy cannot borrow an idle worker's core, so a request that lands on a busy worker waits.
Choose run_sharded when throughput is the constraint and the requests are many,
short and uniform. Keep start — the default — when the slowest percentile is a
number anyone looks at.
pipeline_flush — only if your clients pipeline
#![allow(unused)]
fn main() {
use churust::prelude::*;
let _ =
Churust::server().pipeline_flush(true)
;
}
Answers a batch of pipelined requests with one flush instead of one per response. Off by default because a client that does not pipeline then waits for a flush that only comes once the connection has nothing left to read: measured on loopback with one request in flight, a median 90µs instead of 56µs. Turn it on only if you know the traffic pipelines.
tcp_nodelay — on by default, leave it
Nagle's algorithm holds a small write waiting for more to send while the peer's
delayed ACK holds the acknowledgement waiting for a response; the standoff
breaks on a timer. Churust disables it on every accepted connection. The only
workload that wants it back is pipelining, and pipeline_flush gets the same
coalescing without giving up the latency guarantee.
Where the speed-up came from
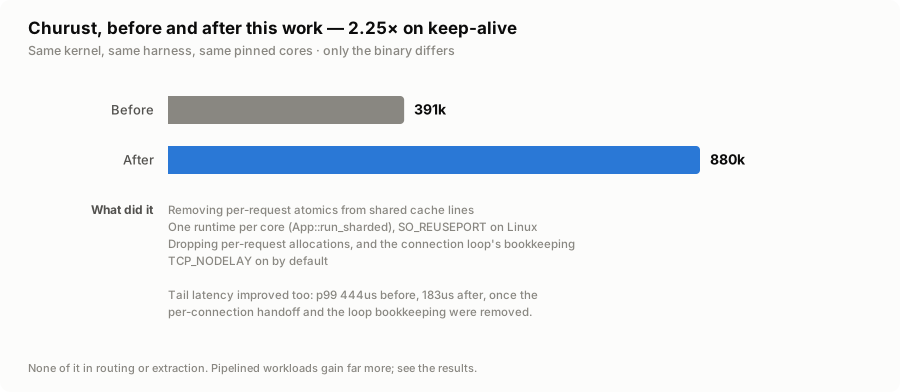
None of it was in routing or extraction, which is where a profiler points first:
- Removing per-request atomics from shared cache lines. The request path cloned the application handle five times per request; each clone is an atomic read-modify-write on one cache line that every core is also writing to. Twelve workers sharing one application reached 1.29M req/s where twelve processes not sharing it reached 2.07M — the same code on the same cores, differing only in whether one integer was contended.
- One runtime per core with connections pinned (
run_sharded), with the latency cost documented above. - Dropping a per-request allocation in the extension map, plus the router, pipeline and response-body allocations listed in the changelog.
TCP_NODELAYon by default, which it should always have been.
On pipelined load the multiple is far larger — aggregating flushes is worth 4.1× on its own — but that is a workload most services do not have, and the 1.94× above is the one to plan around.
Running it yourself
docker build -f benchmarks/Dockerfile -t churust-bench .   # from the repo root
docker run --rm churust-bench
Docker is the supported path because the kernel matters more than anything else here: on macOS the loopback saturates around 45–50k round-trips a second, below what any of these servers can answer, and every framework reports the same number. The same Churust binary measures 47k there and 691k on Linux.
The harness refuses to measure unless all five apps return byte-identical
responses on every route, so a result you get is a result about dispatch and not
about servers doing different work. docker run -e APPS="churust axum" … runs a
subset.